You are here to get live coverage of polls right in front of you from various sources, we embed for you. Thanks to extensive coverage put by the productions, news channels and polls experts on the YouTube.
This gives us an insight overview of what is happening now and what is going to happen at the end of the polls.
We have embeded some News Channels Live Screens and some YouTube experts videos. Please scroll down and watch your favorite.
Also do share with your friends in circle to get to know more about the current scenario of the US Elections 2020.
YOUTUBE LIVE REPORTING:
ABC News LIVE Coverage:
EURO NEWS LIVE REPORTING:
THE TELEGRAPH LIVE COVERAGE:
Know more about Polling:
Hope you will find this stream informative and useful. Please see below about how the maps and polling averages are constructed.
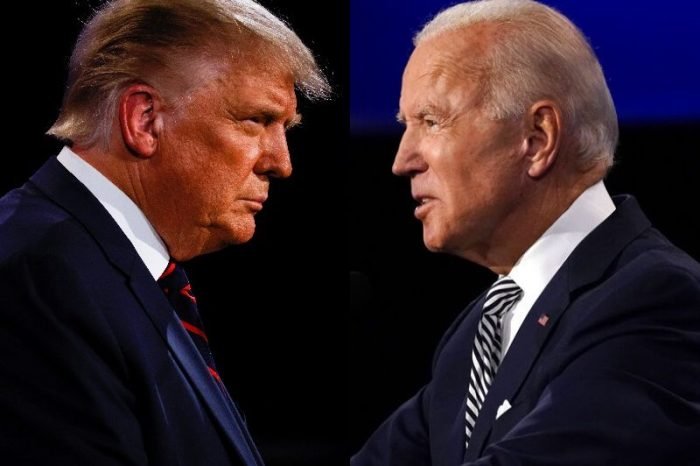
1. How are polling averages (aggregation) constructed? The goal of polling averages is to provide a current snapshot of the polling in each state for the two candidates: incumbent President Donald Trump, the Republican nominee, and former Vice President Joe Biden, the Democratic nominee. Different sources of poll aggregation differ in which polls they include and how they weight them.
a. 270toWin: its polling averages include the most recent poll from each source within the past 30 days, up to a maximum of five. If five polls are found, and there are other qualifying polls on that same calendar date, those will also be included.
b. FiveThirtyEight: its polling averages are a blend of two techniques. The first is to take a simple average of recent polls. The second is to use any of a variety of methods to calculate a trend line of the polls. For most of the race, the average primarily relies on the averaging method, which is usually the more conservative of the two. However, the average leans more heavily into the polynomial method of calculating a trend line in the final couple of weeks of the campaign. Thus, the polling averages can be fairly conservative for most of the race but more aggressive later on. c. RealClearPolitics: a simple average of recent polls.
2. How to use the Electoral Map? The Electoral Map is based on the most recent polling averages. The 2016 election margin is used where there are no polls. States where the margin is greater than 15% are shown as Safe, between 10% and 15% are shown as likely, between 5% and 10% are shown as leans, less than 5% are shown as toss-up. (The thresholds for RealClearPolitics are 20%, 15% and 10%).
3. How are the Electoral Votes in Maine and Nebraska different from those in other states? In all but two states, electoral votes are ‘winner-take-all’. The candidate winning the popular vote normally receives all of that state’s votes. Maine and Nebraska have taken a different approach. Using the ‘congressional district method’, these states allocate two electoral votes to the state popular vote winner, and then one electoral vote to the popular vote winner in each Congressional district (2 in Maine, 3 in Nebraska).

